01
Choose a product to review
Start from the overview or the product list and open the trading example that needs attention.

Commercial performance · Showroom demonstration
A higher selling price does not automatically mean more profit, and higher sales do not automatically mean a better commercial result. To review a change, the team needs to bring the price, sales, costs, orders and stock context together.
Who this is for: Retailers, wholesalers and commercial teams reviewing the effects of product price decisions.
Price change analysis
This demonstration prepares that comparison for a product. It shows the trading history and calculated measures in one view, then lets a reviewer record what to do next. It is a way to investigate the change, not a claim that price alone caused the result.
The fictional products have different stories. One shows stronger trading after a price change; another illustrates how higher sales can sit alongside lower profit. A product affected by stock availability requires a different reading again.
The reviewer opens a product, compares the price and working-day measures, and looks through the trading history. It can record a monitoring decision and a reason, keeping the next commercial action beside the evidence rather than in a separate weekly note.
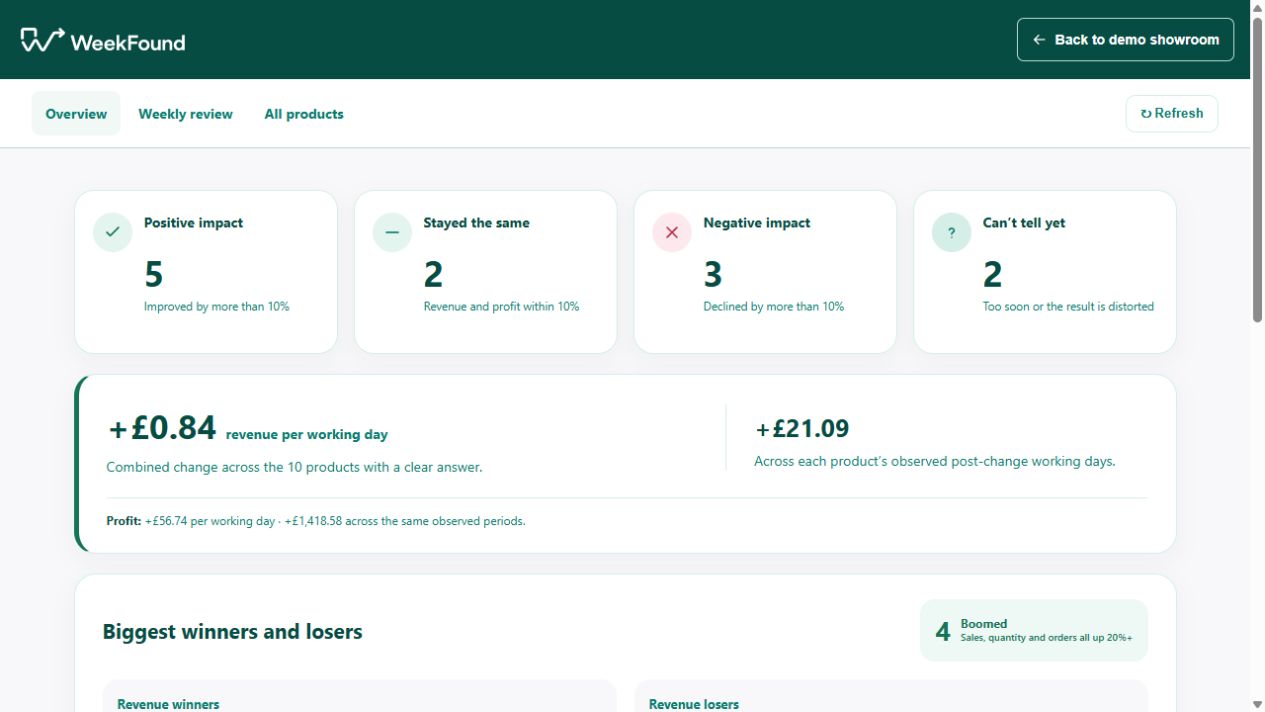
From the repeated task to a reviewable result
01
Start from the overview or the product list and open the trading example that needs attention.
02
Review the price, sales, orders and profit per working day before and after the change.
03
Inspect the populated graphs and the available stock comparison before interpreting the difference.
04
Save a local monitoring decision and a short reason. No live price is changed by the review.
Practical answers
Look at sales volume, orders and profit together, using an appropriate comparison period. A higher price can coincide with lower volume, while a discount can generate more sales without enough margin. The demo prepares the measures; the reviewer interprets them in the business context.
Different periods can contain different numbers of trading days. Comparing a daily measure helps avoid treating a longer period as an automatic improvement. The comparison still needs suitable periods and current data; normalising the days does not remove every other difference.
Yes. More units or revenue may be accompanied by lower margin or higher costs. The fictional examples include different trading stories so the reviewer can inspect sales and profit together. That is a reason to examine the cost basis rather than rely on a revenue headline alone.
If the product could not be supplied during part of a period, weaker sales may reflect availability rather than the selling price. Read the stock context beside the trading measures. An incomplete or unsuitable comparison should prompt further review rather than a confident pricing conclusion.
No. Seasonality, promotions, customer mix, availability and other changes may also influence trading. This page describes observed results after a price change. Stronger causal claims would need a suitable evaluation method and evidence beyond this fictional demonstration.
A weaker result is a reason to investigate. Review the comparison, costs, stock and commercial circumstances before choosing an action. The example supports recording a monitoring decision; it does not prescribe an automatic reversal or publish a replacement price.
At minimum, reliable price-change dates and relevant sales, order, cost and stock history. Agree what each measure includes and how the comparison periods are selected. Start with a product the team can manually check before expanding the review to the wider catalogue.
Your business and existing tools
Begin with a price decision the team wants to understand and the source records behind it. Our business automation approach starts with that repeated reporting work. The measurement guide sets out how to assess an automation’s benefits, and services and pricing explains the current service offer.
WeekFound starts by looking at the repeated work, the time the team spends on it and the mistakes that need correcting. The aim is to give the existing team more capacity as the business grows.
The commercial team interprets the evidence and decides whether to monitor, investigate or change a price. The observed comparison is not proof that price was the only cause.
Measure the work involved in preparing and checking the review, then assess whether the team can make a better-supported decision. Keep data quality, the interpretation and any later commercial outcome separate. The examples do not establish measured client savings.
Start with one useful piece of work
Tell us how the task works today, where it gets stuck and what a correct result needs to look like. We can then assess the work, the source data and the review points before agreeing a suitable approach. Essential work should retain a usable manual fallback if an automation or source system changes.
Discuss this workflow